Friday, November 22, 2019

The future of the NBN (6): UK(2030) vs China(2019)

Two reports recently from China and the UK on their broadband rollout plans, report:
  • a promise "to deliver free full-fibre broadband to all individuals and business by 2030.... [further we] will aim to deliver free full-fibre broadband to at least 15-18M premises within five years" Link, Nov 16, 2019
  • Update: June 2019 report on Internet released (pdf); noting 395.75M Fibre (FTTH - Fibre to the Home, FTTO - Fibre to the Office) connections "accounting for 91.0% of all Internet broadband access users" (p.11) and 77% of broadband subscribers at 100Mbps or over; (p.11), up from 39% at the end of 2017.
The first is the promise of the UK Labour Party for the upcoming December 2019 UK General
 Courtesy: Nick Youngson CC-BY-SA
Election. The second shows the progress China has made in the last ten years. See graphs from the China report below.  You can compare earlier analysis I made of China progress (NBN Future Part 2), from 2012-17.

UK

UK regulator, Ofcom, reports (Sept 2019, p.9) that 95% of premises can access a 30Mbps broadband (superfast) service, while only 54% can access a 300Mbps (ultrafast) service (about 16M premises). In contrast, Ofcom reports current broadband connection (by technology) Q2 2019 as:
  • ADSL 8.4M
  • Cable 5.3M
  • Other (inc FTTx; predominantly Fibre) 13.0M - but full-fibre homes (2018) - 1.8M(Connected Nations, p.1).
Another Ofcom report (International Broadband Scorecard 2018), comparing UK to EU countries and 18 other international countries (2017, Figure 1.8), breaks UK broadband down by technology and speed, noting VDSL is active in 35% of connections, cable 20%, ADSL 44%, full-fibre (1%). Also they report 14% of connections above 100Mbps (including 4% above 300Mbps), 42% under 30Mbps, including 2% under 10Mbps, and 44% in between (Figure 1.7).


The same Ofcom report (International Broadband Scorecard 2018; Figure 1.26) notes that at the end of  2017,  Japan has 98% full-fibre coverage, and Korea over 99% full-fibre coverage (Source: IHS MARKIT), and (Figure 1.27), meaning that close to 100% (98-99%) of households in Japan and Korea have access to the fastest broadband (over 300Mbps). China is reported having 45% of households who can access similar (ultrafast) speeds (US 61%, NZ 70%, DE 34%, AU 0%; Figure 1.27, Fixed Broadband coverage by advertised speed). In Figure 1.29, the percent of broadband connections over 100Mbps (end 2017) is reported, including Korea (76%), Japan, (74%), Sweden (78%), US (28%), China (14%), UK(14%), NZ (11%), AU (3%), among .
Interactive data is also available (full-screen required) providing international comparison.

China Fibre Broadband (2019)

Fig 11 Scale and Proportion of Fibre Broadband Users
- CNNIC China Internet Statistics 6.2019, p.11

Fig 10 Proportion of Subscribers of Broadband at the Speed of 100Mbps or above
- CNNIC China Internet Statistics 6.2019, p.11


China, in its annual Internet Statistics (CNNIC), recently updated for 2019, demonstrates a significant investment into fibre broadband. It also shows that China is close to completing a full fibre network with 395M fibre connection users; some 91% of all broadband users. Of these users, 77% are accessing broadband at 100Mbps or above (substantially more than the 14% reported in the Ofcom report - International Broadband Scorecard, at end 2017, mentioned above). When China (CNNIC) says fibre, they explain in a footnote (p.11) they mean FTTH/O - Fibre to the Home, or Fibre to the Office. An earlier post (Future NBN 1), shows China Fibre rollout 2012-17.

The Labour Party says the UK is falling behind in broadband, with only 8-10% of broadband users accessing full-fibre services, which they compare unfavourably to Japan (97%) and South Korea (98%). These percents turn out to be percent of households with access to, rather than subscribers of, fibre broadband. Japan has 60% households connected to full-fibre, whereas South Korea has 40% or 80% connected to fibre, depending how you classify one type of common Korean broadband connection.

South Korea

My previous examinations (NBN Future 2) of South Korea, showed in 2017 only around 40% on full-fibre, with 25% still on HFC and ADSL. A significant category called LAN, is likely to be FTTB (connecting the basement of residential buildings to fibre, and using LAN to distribute broadband within the building), had around 40% of broadband subscribers. Even if LAN and FTTH were both counted (about 80%), the total is substantially lower than the 98% the Labour Party suggests.
Recapping (Netmania), South Korea's broadband connections (2017) consist of:
  • LAN (presumably FTTB): 8.6M (40%)
  • Fibre to the Home: 7.7M (36%)
  • HFC: 4.0M (19%)
  • DSL: 0.9M (5%)
NB:See further Korea broadband data noted in the UK Ofcom report (International Broadband Scorecard) mentioned above.

Japan

The Japan Statistics Organisation - Statistics Bureau of Japan reports on telecommunications including fixed broadband services, for their 53M private households (Link, Ch. 2). The 2019 Statistical Handbook of Japan reports total 41M fixed-broadband subscribers (Table 8.6. Subscribers to Telecomms Services (2018), p.93 - totals to 42M, strangely):
  • Fibre to the Home: 30.3M (72%)
  • Cable Internet (HFC presumably): 6.9M (16%)
  • DSL: 2.1M (5%)
  • ISDN: 2.9M (7%)
NB: See further Japan broadband data noted in the UK Ofcom report (International Broadband Scorecard) mentioned above.While these figures represent significant users of broadband (Japan is placed 3rd in the world behind US 110M, and China 393M; p.94), rather than who can access broadband, the number of full-fibre users is substantially lower than the Labour figure, closer to 60% of total households, than the Labour Party suggested 97%.

China

What the Labour Party seems to be missing, is that while the UK is far behind Japan and South Korea, the UK is also substantially falling behind China. China's 395M full-fibre connections (Fig 11 above) is a significant proportion (86%) of their 456M total households (Wikipedia). Not only are fibre connections in place, but there are subscribers using the services, and 77% of those subscribers are consuming broadband at 100Mbps or more. In Summary, China's broadband is:
  • Fibre to the Home/Office: 395M  (91%)

So, the UK is looking ahead to a broadband future, where everyone is connected in 2030 to full-fibre (and 60-70% within five years; that is 15-18M households of total 26M; Wikipedia). Japan is 60% full-fibre connected there now (but every house can access fibre, per Ofcom). Korea is 80% full-fibre connected there now (if you count FTTB as full-fibre, only 40% if you don't). But China is close to already fully connected with close to 90% already on full-fibre, and with the result that nearly 80% of subscribers are using broadband at speeds at or above 100Mbps.

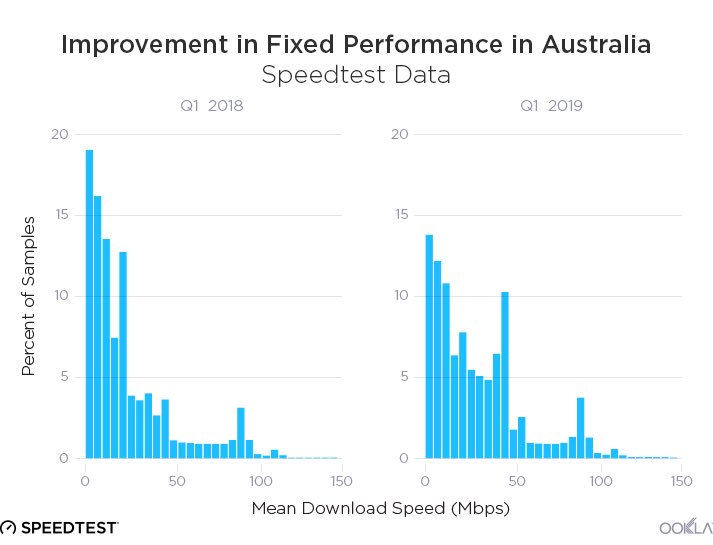
In contrast, Australia reports to OECD (end 2018), 0% broadband users at speeds at/above100Mbps (NBN Future 1).

Friday, August 30, 2019

The Future of the NBN (5): Fast National EU Plans vs Fast Services

In the last post I looked at EU NBN (national) plans for 28 countries. These national plans nicely group into several different target clusters, including:
Compare: Pixabay

  • 30mbps coverage by 2020 (Many including Greece, France, Spain, Poland, Hungary, Ireland and 12 others )
  • 50mbps coverage by 2020 (Germany)
  • 100mbps coverage by 2020 (Sweden, Italy 85%, Netherlands 2023)
  • 1000mbps coverage by 2025 (Luxembourg 100%, Sweden 98%, Belgium 50%, Netherlands vast majority).
I wanted to compare these clusters against current Speedtest world speed rankings. When they didn't compare neatly, I thought about what other broadband indicator is going to give a better indicator of fast average usage, than a national target. That's when I thought to compare average speed (per Speedtest Global Index) with OECD count of number of very fast users (over 100mbps).

In national targets, Australia sits close to Germany, with 90% of fixed line aiming to get 50mbps, and rest 25mbps.

Let's compare.

NBN target (mbps)Cntry Speedtest Ranking  Speed Down Users/100 over 100mbps(OECD 2018)
30mbpsGR 96230
30mbpsFR 151085
30mbpsESP 171079
50mbpsAU 60 400
50mbpsDE 34736
50-100mbpsCN 2490>4
100mbpsIT 46518
1000mbpsLX 16107na
1000mbpsSWE 1411026
1000mbpsNE 209914
Table 1: Speedtest results (2019) - Ranked by NBN Target
The first table compares NBN targets for country with Speedtest actual speeds. The Speedtest rankings do not line up very well with the NBN targets for each country. France and Spain have low targets but high rankings. Italy and Australia have a quite high national target but quite low Speedtest rankings. NB: China has 4% superfast users - data is only found for gigabit users (post 2).
Now we retry the comparison, sorting by percentage of very fast users (over 100mbps). I include CN (China) data from my post below. OECD data (xls) comes from post below too.
NBN target (mbps)Cntry Speedtest Ranking  Speed Down Users/100 over 100mbps(OECD 2018)
50mbpsAU 60 400
30mbpsGR 96230
50-100mbpsCN 2490>4
30mbpsFR 151085
50mbpsDE 34736
100mbpsIT 46518
30mbpsESP 171079
1000mbpsNE 209914
1000mbpsSWE 1411026
1000mbpsLX 16107na
Table 2: Speeedtest results (2019) - Ranked by Users of 100+mbps (OECD 2018).
Source: Speedtest Global Index - July 2019, EU summary of NBN plans (post 4), OECD (post 1), China (post 2).
The second table compares adoption of over 100mbps speeds (OECD 2018) with Speedtest actual speeds.
This analysis suggests that the Speedtest ranking is more closely related to (1) how many users are on fast (over 100mbps) speeds than (2) what the country's NBN target is. Again Italy stands out as a high performer on number of very fast broadband users, but scores low average Speedtest results. This suggests there are very fast and very slow speeds available across the country leading to a lower average. Australia, Greece and Italy are the only countries not exceeding their national broadband targets (excluding the gigabit targets).
Conclusion: To improve your average speeds, you can either lift everyone's speeds, or push superfast access to a small minority. Small percentage levels of 1000mbps can substantially lift average speeds.

Wednesday, August 21, 2019

The Future of the NBN (4): EU collates their National Broadband Plans

As Australia's NBN approaches completion, some 12 years after Kevin Rudd took the NBN to an Australian election, many nations are now nearing completion of their own version. A European document, neatly compares 28 countries within the EU, and their national broadband targets. I summarise this list below.

Data: See the EU document (pdf - Slide 37), html. Full Report (pdf 328pp), and EU Strategy for a Gigabit Society.
EU National Broadband Plan - Targets
Some examples include:
  • Slow: Greece/Italy 100% coverage - 30mbps - 2020 (plus 17 others)
  • Usage: Greece/Spain 50% penetration (ie usage) - 100mbps - 2020 (plus 14 others)
  • Medium: Germany 100% coverage - 50mbps - 2020
  • Fast: Netherlands at 100% coverage - 100mbps - 2023 (plus six others similar eg Italy 85%, Sweden 95% at 2020)
  • Superfast: Sweden 98% coverage - 1Gbps - 2025 (plus Netherlands (vast majority), Belgium 50% and Luxembourg 100%)
  • UK 100% fibre coverage - 2033 (and 15M premises by 2025).

Comparing EU to AU

Looking at these clusters, Australia's NBN seems to sit closest to Germany, with 90% of fixed line network, getting at least 50Mbps, as well as the base 25mbps target for 100% coverage. Australia has neither a usage target (besides Corporate Plan targets of 75% usage) nor gigabit target. The current MTM allows up to 50% of premises to access gigabit once NBN activates upgrades to HFC, FTTC, FTTP.
Structured data (csv) follows: (MacOS 10.14.6 Numbers 6.1)

Country,Cover%,Type,Speed (mbps),Date,Comment
Greece,100,coverage,30,2020,"Inc Cyprus, Spain, Malta, Poland, Lithuania, Latvia, Italy, Czechia, Croatia, Bulgaria, Estonia, France (2022), Hungary (2018), Ireland, Portugal, Romania (inc 80% > 30mbps), Slovakia, Slovenia (last 4%)"
Greece,50,Penetration,100,2020,"Inc Bulgaria homes (Businesses 80%), Croatia, Cyprus, Czechia, Estonia (60%), Hungary, Ireland (inc 17-21mbps up), Latvia, Lithuania, Malta, Poland, Portugal, Romania (45%), Spain, Sweden"
Germany,100,coverage,50,2018,
Belgium,50,Penetration,1000,2020,"Inc Luxembourg (100% coverage, 500Mbps up), Netherlands (vast majority by 2023), Sweden (98% coverage by 2025)"
Denmark,100,coverage,100,2020,"Inc Denmark (30mbps up), Sweden (95%), Austria (99%), Finland (2025), Italy (85%), Netherlands (2023), Slovenia (96%)"
UK,100,Full fibre,n/a,2033,Inc 15M premises by 2025
// Source: https://t.co/YFd9pA8LZe - slide 37

Friday, August 2, 2019

The Future of the NBN (3); the business opportunity

The national NBN rollout is coming close to its finish, with now 11 months until expected completion. By 30.06.2020, all premises should be RTC (Ready to Connect), some 11.8M homes and businesses. But the Corporate Plan while targetting eventually some 75-80% users, expect activations to ramp up from:

When | Planned NBN Activations
30.06.19 | 5.5M
30.06.20 | 7.5M
31.12.20 | 8M
30.06.21 | 8.4M
30.06.22 | 8.7M
Source: NBN Corporate Plan 2019-2022.

Current NBN ARPU is around $44 per month (total revenue 2019;  $2.6B), with a expected rise to $54 in 2022 (total revenue 2022, $5.6B). These numbers update annually, with the Corporate Plan for 2020-2023 to be released shortly. What those ARPU numbers average out is the split between business and home revenue. Business services while much smaller in number, are substantially greater in revenue per premise.

For our home broadband service, for instance, I pay $60 per month  to retailer Exetel (which is about NBN $45 wholesale), for a 50Mbps unlimited data line. Plenty of speed for a small family, watching 4K video and a home office running low bandwidth applications. But what if I wanted to upgrade to gigabit service with business grade services?

What does Enterprise broadband cost? Enterprise NBN?

I can get a 200/200 Telstra fibre service through my current broadband provider, Exetel for $1000/mth, on a three year contract with $0 setup. I can get a gigabit service with a three year contract from TPG ($880/mth; $1100 setup), iinet ($880/mth; $1800 setup) or AussieBB ($770/mth; $0 setup). The AussieBB service is a TC4 best effort service (with 100/100mbps speed shaping during home video peak hours 6pm to 12am). AussieBB also offers a TC2 committed bandwidth service accessory at 50/50mbps for $440/mth extra. Support packages are an extra $220/mth (Silver support, 99% uptime) or $330/mth (Gold support, 99.95% uptime). All these services come with unlimited data.

It is clear that these business NBN / fibre services are significantly more expensive than my $60/mth home NBN service. But the NBN services are significantly cheaper than the Telstra product, which Exetel is offering. Up to five times faster (1000/400 vs 200/200) for a similar or slightly better price ($1000 vs $800 per month).

It is interesting to look at the prices for the business service. You need to leave your name, and contact details, so a salesperson can talk to you about the service. And then they send the prices to you. This was my experience with Exetel and AussieBB. TPG and iiNet did show the prices for Enterprise Broadband on their websites, and are 1000/1000 symmetric services. AussieBB is an up to 1000/400 Enterprise service on NBN.

Another NBN Business service is called Enterprise Ethernet (pdf) with speeds up to 1000/1000, $0 install on three year contract, and available as an upgrade anywhere in the NBN fixed line footprint. Downloading a brochure for the service requires providing your name, company name, and contact details (phone and email). The brochure doesn't seem to provide specific costs for Enterprise Ethernet, beyond the TC4 (best effort; 1000/400 at $770/mth) and TC2 (committed rates; 50/50 at $440/mth).

What is the potential revenue from the Business Internet market?

The ABS provides statistics of number of businesses in Australia by size. In total there are more than 2.3M active businesses in Australia, but most are small. There are 1.3M businesses with no employees. There are 0.8M businesses with some but less than 20 employees. Around 50,000 have between 20 and 200 employees. And only 4,000 have more than 200 employees.

Employees | Count of Businesses
0 | 1.3M
1-20 | 0.8M
20-200 | 50K
>200 | 4k

It is likely that the no-employee businesses (unless in a specifically technical industry, such as video editors) would likely use just home level NBN, particularly if they can access 100/40. NBN has promised that 90% of the fixed line footprint will get 50mbps and 25mbps for everyone else.  But businesses with multiple employees would likely need Enterprise NBN. If all of the 1-20 employee businesses took a $500/mth Enterprise Broadband service, that would generate around $5B revenue per year, equivalent to all the expected NBN revenue. Obviously, this revenue would be highly contested between those telcos with substantial fiber networks, such as Telstra, Optus, TPG, Vocus, who can reach many businesses. But NBN's advantage (opportunity) and weakness (who to target) is that NBN runs past every business.

Businesses with larger numbers of employees (over 20) would pay substantially more per business for internet. These businesses would be the site of substantial competition for their telecom expenses.

What NBN revenue might employee broadband generate?

AARNet generates $80M revenue (Annual Report 2018) for providing internet to the University (and education) sector, which employs 130,000 staff (excluding schools). This works out to about $50/mth per person. This is a little overstated, since there would be schools generating revenue whose staff are not counted, making the average a little high. Nevertheless, each employee is a potential roughly $50/mth NBN revenue source for internet costs. With 13M current employees (Labour Market Information Portal, May 2019), that equates to about $8B revenue per annum, in possible NBN revenue.
I can think of businesses with lots of staff but not much need for internet eg restaurants. I can think of businesses with few staff but lots of need for internet eg anything video related, software related, data related, research related.

Summary

The Business market is a substantial opportunity for the NBN, but with likely significant competition from the likes of Telstra, Optus, Vocus and TPG. There are billions of dollars in play. With likely costs per employee to fall to around $50/mth for internet (AARNet's cost for the University sector). How much of a premium telcos can extract from businesses for Enterprise quality NBN remains to be seen.

However, it is possible NBN could generate substantial ($billions) revenue from businesses. Even a 10% market share is close to $1B annually, which would reduce the ARPU for homes required for the NBN to break even and repay its debts. A 50% business market share could go close to double NBN's revenue and pay for substantial upgrades to the fixed line network.

The opportunity is there for NBN to seize, and for Telstra and competitors to lose.
==
Update: 15/8/19 NBN Co reports their 2019 result includes Business Revenue of $388M up 54% on FY18 ($252M). This is 14% of total revenue $2.83B (up 43% FY 18 - $1.98B), and similar to FY18 business proportion (13%). ARPU increased from $44 to $46 per month.

Wednesday, July 24, 2019

The future of NBN (2); comparing AU to Sth Korea and China

In thinking about the value of an Australian post-build NBN, it is useful to compare where other countries are at. In the last post, I looked at NZ, compared AU actual speeds from 2018 to 2019 (thanks Speedtest), and the OECD broadband speed tables, especially the % of connections which are over 100Mbps. Lately, I have been looking at China and South Korea. South Korea, because it is close to the top of the broadband usage, so might be useful in thinking where AU is headed, and China because as a large trading partner and economic competitor is useful to see where broadband  fits within economic and innovation investment priorities.

1. South Korea

I found a website (Netmania.com) which reports Korean broadband statistics. Korea's population is around 51M in 2019. Korean count of households in 2005 was about 16M, so with population growth is likely now about 18M.
Netmanias.com
As the graph above shows, FTTP has risen to 8M households in 2017, as total connections reach 21M, exceeding the number of households. HFC remains reasonably steady over ten years, falling slightly from 5M to 4M. DSL subscribers fell substantially over ten years from 6M to 1M. A LAN(UTP) service rose from 3M to over 8M, ahead of FTTP - this is possibly a type of FTTB. Interestingly FTTP while significant is one of three major technology types.
Korea is looking at next generation broadband, aiming for 50% adoption of 10Gbps by 2022, presumably over the FTTP, which would rise to 50% of total households (from 8M to 9M). Netmanias reports 24% of KT Subscribers have gigabit internet in Q3 2016 (around 2M services; after 7 quarters of availability).
Interestingly, Netmanias report, Korea's telcos (SK Telecom, KT and LG U+) make only a smallish proportion of their total 2017 $52B revenue from fixed line broadband; around $12B of total. Most revenue comes from mobile ($21B) and handsets ($6B).
Current pricing for gigabit services in Korea (with unlimited data) is around $60 per month on a one year contract (SK Broadband) plus setup costs ($25) and monthly equipment rental ($5/mth). Speed is limited to 100Mbps when exceeding a 100Gb data limit (per day).

2. China

2.1 Overall

China, a country of 1.45B people and 450M households has recently upgraded its broadband. By 2017, 84% of broadband users had a FTTH connection; some 290M households, according to the most recent CNNIC report (end 2017, p.27-28; see graph below- note: 10k scale). The graph below shows that China fibre broadband rose from 20M users (2012) to 290M users (2017), including some 62M connections added in 2017 alone. (Update: June 2019 report released (pdf); noting 395M Fibre connections (p.11) and 77% of broadband subscribers at 100Mbps or over; p.11).
CNNIC - China Internet Network Information Center (2017)

2.2 China Strategy

China pushed their broadband forward in a 2013 China Broadband Strategy and Implementation plan. Further the General Office of the State Council, issued "Guiding Opinions on Accelerating the Construction of High-Speed Broadband Networks, Increasing the Network Speed and Reducing Access Charges" per CNNIC report (p.56).The broadband targets in China were:

Year Speed(Mbps) %Urban Comment
20152050%
20205070%plus 50% at 100Mbps, some gigabit

2.3 China Mobile - Qtrly stock market reports

More recent information comes from China Mobile who reports quarterly to investors. China Mobile at the time of the CNNIC report, reported 109M fixed broadband users (up from 74M in 2016). In 2017, around 70% of their wired broadband subscribers, China Mobile reports, subscribe at over 50Mbps speeds. By Q1 2019, China Mobile report 167M wired broadband customers, up 10M for the quarter (plus a breathtaking 963M mobile subscribers (723M on 4G), using 6Gb of data monthly, up 162%). Thus China Mobile would have around 30-40% of the fixed broadband market and the China households (by 2019) are fully connected to broadband, likely at more than 85% on FTTP.  Fixed Broadband ARPU was RMB 31 (about $6) per month.
What does this rapid and extensive rollout in China mean for the value of Australia's NBN? More thoughts to come...
Update: China Mobile reports (p.17) in Q2 2019, 175M wired broadband customers, with 80% over 100Mbps on "1000Mbps all-optical fibre broadband network", up from 135M (2018). ARPU is 35 RMB (less than $10AUD/mth).

3. Analysis

Sth Korea has followed a more NBN like approach with multiple technologies. HFC still plays a part (about 25% of households), but the next generation target is only for 50% of households - similar to the NBN level of gigabit-ready households. China in contrast has (at least two years ago) around 85% of urban subscribers on FTTH. Last time we noted that the US has around 30% of subscribers on over 100Mbps plans (around 30M connections). China, has the potential at least to have 85% (about 290M plus premises) on over 100Mbps plans. NZ already has 10% of subscribers on gigabit plans. Sth Korea's KT has about 25% of its subscribers on gigabit services. While Australia, until affordable gigabit services arrive has effectively 0% of NBN subscribers on gigabit services.

Gigabit Users and Potential Users (or over 100Mbps**) - selected countries

Country  Gigabit (100Mbps) Users Gigabit % Gigabit access potential %(M users)
AUnil^ 0%^50% (5M)
NZ0.1M^10%^90% (1.8M)^
Sweden(2-3M) ?? 98% by 2025 (3M)
Sth Koreaest 4M (per above^^)25%^^50% by 2022 (8M)^^
US3M [1] (30M)^ about 30%** ?? at least 66M HFC
China (p.4)19M (Source [1])4%over 85% potential (>290M)
Source: ^ - prior blog post
So Australia with 50% of potential gigabit users is in line with South Korea as a leading broadband nation. But moving from potential to actual users, depends on the value of the NBN offer. A competitive price would likely be similar to NZ, at around $100 per month, but that price so far has only attracted 10% of users to gigabit.

One commentator suggests in most countries gigabit will rise to 30% by 2023, and in some countries (France, Switzerland and South Korea, China) to 40-50% of households.

4. Unanswered questions:
  • how many gigabit users in China? What will gigabit cost? (300 Yuan($60)/mth; China.org.cn)
  • what speed do users in China connect at? (Speedtest #28; avg 85Mbps)
  • when will AU NBN introduce gigabit services? At what price? Current TPG Business service $880/mth on 36mth contract (ie $32k). See more at NBN Business analysis. Update (Sept.19): NBN proposes household gigabit (1000/50) service at $80/mth wholesale (Whirlpool), likely to retail around $130/mth.

Wednesday, July 10, 2019

The future of the NBN; one year to completion

As we start 2019/20, the 2020 end of the NBN rollout is now very close. The weekly NBN progress report shows 8.1M brownfields premises are Ready to Connect (of total 9.8M), and overall 5.5M premises are connected. So now, our thinking turns to what next after the rollout is complete.
Jeremy Segrott, Flickr (CC-BY)

There will still be:
- getting all the ADSL network shut down,
- getting as many premises as possible on to the NBN, not least in trying to find the right combinations of price and service to suit the diversity of Australian households
- trying to earn a profit from the completed network, and lastly
- thinking about what next.

Three data points, I came across this week, give pause for the what next question.

1. NZ quarterly report of their NBN; the UFB;
While NBN reaches 5.5M activated premises (about 47.5%), Chorus in its 2018 Annual Report advises that their activations have risen from 35% to 45% (p.1). Across the whole of NZ, UFB Quarterly Report shows their activations include 8% on 1Gbps (64,000 connections), and 6.5% on 200Mbps (49,000 connections), with the remaining 85% (645,000 connections) on 100Mbps or less.

What next for NBN includes when to activate 1Gbps services, and at what price.
The broadbandcompare.co.nz website, shows NZ services can get 1Gbps service for about $100NZD per month, with unlimited data, 12mth contract, and $150 for a modem/router. If NZ can only get 10% of connections onto gigabit at $100 per month, then don't expect Australia to reach 10% gigabit unless it is priced affordably and competitively. That is, at $600 per month for gigabit, expect only low single digit percentage household uptake. There may be more interest from businesses at this price.

NBN says 50% of the network will be gigabit compatible, including HFC, FTTC and FTTP. With Gigabit worldwide activated in 2017, Speedtest reports only around 400,000 users. Australia will soon have 4M gigabit-capable NBN premises. But whether they will use gigabit will depend on need and price - hence the value of gigabit.

Chorus (the wholesaler) in their 2019 half-year presentation, say their gigabit charges are $60 per month for Residential and $75 per month for Business connections

2. Speedtest compares Australia, Saudi Arabia and Ireland
While the analysis of the three countries was not that interesting, a graph of Australia's broadband was very interesting. Speedtest provided a comparison of AU broadband speeds in 2018 and 2019 speeds in a graph at 5Mbps intervals. Their testing shows no measureable  usage over 100Mbps. Each 1% equates to about 100,000 households. There are obvious NBN peaks just under 50Mbps and 100Mbps,  and obvious gains in those peaks between 2018 and 2019 (see the Data).


The graph shows under 25Mbps falling from 70% in 2018 to 50% in 2019. In the same time average speed increases from 25Mbps to 30Mbps. If all the under 25Mbps were to be removed, then the average for Australian would be around 50Mbps. This does not take account of underperforming NBN services such as congested fixed wireless.

This data and graph shows Australia is quickly improving. But compared to the top 20 nations who are averaging close to 100Mbps, we are well behind. Not until gigabit takes hold will the Australian average leap forward. The NZ UFB (per the 2019 Q1 report) averages around 170Mbps with the 8% gigabit having a big impact on lifting the average.

3. OECD compares member countries by broadband speed, including per cent of connections over 100Mbps.
OECD data (xls)  on broadband speeds for 2018 has Australia on 0% of connections over 100Mbps. This puts Australia, next to Greece at the bottom of the OECD. In total about 70M connections over 100Mbps are noted across 37 countries. The US has about 30M of these connections (about 10 per 100 people). The next biggest countries being Germany (4.9M), Italy (4.6M), UK (4.3M) and Spain (4.0M), at either 15% (DE, UK) or 25% (IT, ES) of broadband connections. By percentage the most over 100Mbps connections are Switzerland (84%), Sweden( 67%), Portugal (63%) and Belgium (52%), but in total these countries only have about 11M total connections over 100Mbps, about 2-3M each country.
Fixed Broadband - OECD 2018 - Fast (<100), Slow (<25) per 100 people

There is also comparative data (archive.org | xls) from 2016, so it is possible to see how fast people are adding over 100Mbps connections. And now I also retrieved 2014 data from the OECD Digital Economy Outlook 2015 (Broadband speed data (xls); Figure 2.26, p.109).
The graph and underlying data and calculations are available at:
Ferrers, R and OECD. (2019): How fast is Australia's broadband (vs OECD) - 2018? figshare. Dataset. Online at: https://doi.org/10.6084/m9.figshare.8116079.v2 This data was posted in response to NBN's report on their recalculation of NBN in the world speed of Broadband race.

Tuesday, February 19, 2019

The value of non-profit: Dryad and California Digital Library

Workshop: Accelerating Data Publication: new models for research institutions. Melbourne 8 Feb 19.

I attended a workshop the other day, where John Chodacki, Director, UC Curation Center, California Digital Library, pitched an idea for a Data Repository, run by the non-profit organisation, Dryad. Dryad, accepts researcher's data, for (as John mentions) around an average $120USD processing fee, which covers the curation cost to check all submissions (data files and data description), and to hold the data long-term to support a publication related to the data. Here are the slides and Etherpad. Per Dryad's website, the charge per publication is calculated as a $120USD processing fee plus a storage fee if a researcher submits over 20Gb data ($50 per 10Gb). Most datasets come under the data cap, John says. This fee is waived, upon request, for researchers from lower  - middle income countries (per World Bank definitions).

John had another idea, for how to use Dryad, for his University of California (UC) researchers. UC had been considering building their own repository from scratch, but thought their funds might be better spent building on top of an existing platform - where researchers were already depositing their data. Apparently 90,000 researchers (Slide 55) already have deposited data at Dryad, and Dryad provide data deposit for over 900 academic journals (Slide 55).

John's idea was to use Dryad as an Institutional service, where the University could pay an annual fee, then their researchers would no longer need to pay a per article data deposit fee. Talks with Dryad began, and they agreed to seek support of other institutions to promote the new service. Fees were agreed on a sliding scale, where a big Institution would pay more (about $13,000 USD per year) and a smaller Institution would pay less (about $3,000 USD per year).

At the workshop I attended, there were representatives from a number of Australian Universities and research organisations; RMIT, Deakin, Victoria University, CSIRO, University of Sydney, University of New South Wales, Queensland University of Technology, Aarnet, Monash University, plus myself and my colleagues from ARDC, the Australian Research Data Commons. In a final quiz item, the attendees said they were interested in the new service, but that they were not the ones to sign off on that type of purchase. It raised the question of what was the next steps. How could Australian institutions contribute to interest in this new idea for a repository? This blog post was one of those next steps.

There were a number of obvious benefits:
- paying a non-profit community run organisation, rather than a commercial provider, so it should be a little cheaper
- community can drive what the system looks like, and the functions can be responsive to community needs
- using a system that already has a lot of researcher users (over 60,000), and journal integration.
- using a trusted system (certified with CoreTrustSeal recognised certification).

But there were some obvious challenges:
- if you were to use this system, how would we transition from our current system to this new system?
- would there be local support in Australia to help users, and help Institutions make a business case, and help researchers use the Dryad system?

There were a number of questions raised:
- where would the data be stored? In the US. But a copy could be kept locally.
- what about sensitive data, which has to be stored in Australia (or an equivalently privacy-protected jurisdiction ie not the US which has weaker privacy rules)? Dryad doesn't accept sensitive data, so where the data is stored should not be an issue.
- what size data can be sent to Dryad? (As a file up to 10Gb; and from a URL up to 100Gb)
- can we use specific data description types (vocabularies)? Should be fine, John said.
- can we get descriptions of data belonging to our Institutions, back into institutional systems? Contact Dryad for discussion.
- have CDL/Dryad talked to the Australian infrastructure provider, QCIF, who manages the RedBox repository? or Figshare? about how to create a win-win amongst the various repository providers? No, but there is enough room in the ecosystem to allow different repositories to service different users/
- were there any plans to have people in Australian to promote the services and educate institutions and users about the benefits of the system, like Figshare's sales team? Not at this stage.

Later that same day, I was at another event, and spoke to Natalie Meyers, University of Notre Dame, who is an ambassador for the Center for Open Science and interested in having more integrations with the Open Science Framework (OSF). She wondered if by engaging a larger community to join a Dryad Institutional service, there might be incentive to enhance the Dryad API to make it more consumable and its endpoints more interoperable with other open science platforms like OSF? John, in response, says the new software development work  at CDL/Dryad will provide exactly this type of opportunity by leveraging CDl's DaSH API (see API docs and github repo). 

So, it is obvious that the community needs to keep talking about what to do next, what questions are still left unanswered, and how to sell the idea to the money people at your institution. That will require at least in the beginning, glossy flyers, and ultimately a business case to assess the costs and benefits. See also the Dryad blogpost (May '18) announcing the partnership with CDL (follow up Oct '18 post).

If you have any questions, please post them in the comments section below and I will send them along to John (john.chodacki - at- ucop.edu) to answer.

NB: Where I work at ARDC, we have a policy of vendor neutrality, so this post should not be read as an assessment of the value of the CDL/Dryad service, but does seek to point out the many issues to be wrestled with in making a value assessment.
=
Thanks to Natalie and John for their feedback on this post.