Committee Focus
The Committee were interested in "the rollout of the [NBN] and the performance of nbn co", particularly:a.the economics of the NBN, including key operational and financial performance forecasts in the Corporate Plan 2020-23;
b.current pricing structures, including wholesale pricing, affordability and take-up, particularly as they relate to low-income and rural and regional customers;
c.network coverage issues; including reporting of outages planned and unplanned
d.the delivery of the business segment strategy, including to enterprise and government customers, and small to medium businesses;
e.the experiences of small and medium business in relation to the utilisation, accessibility, customer service and affordability of the NBN;
f.compliance with the NBN Statement of Expectations and adequacy of that Statement
g.any other related matters. Source: Parliament of Australia
Australia vs OECD and Top 10 Trading Partners
I presented the material from the future of the NBN posts (1-6), especially NBN speeds vs OECD, but narrowed that down to Australia's Top 10 Trading Partners (Source; OEC - Observatory of Economic Complexity), which are an interesting mix of countries, including:- China | United States | Singapore
- South Korea | Japan | New Zealand
- Thailand | India | Germany | United Kingdom.


Summary of Australia's Top 10 Trading Partners - NBN Plans - Appendix 1 - Submission
| Country | Target | Speed (Mbps) | Year | |
|---|---|---|---|---|
| Australia | 90% | 50 | 2020 | |
| Australia | 100% | 25 | 2020 | |
| China | 50% | 100 | 2020 | |
| China | 70% | 50 | 2020 | |
| China | some | 1000 | 2020 | |
| India | 100% | 50 | 2022 | |
| India | Villages | 1000 | 2020 | |
| India | Villages | >1000 | 2022 | |
| Japan | 98% | Fibre | Now | |
| New Zealand | 75% | Fibre 100 | 2019 | |
| New Zealand | 87% | Fibre 100 | 2022 | |
| Germany | 100% | 50 | 2018 | |
| Germany | Regional | 1000 | 2025 | |
| Singapore | ?? oops left it out - in error | |||
| South Korea | 99% | Fibre | now | |
| South Korea | 50% | >1000 | 2022 | |
| Thailand | Cities | 100 | 2020 | |
| Thailand | 95% | broadband | 2020 | |
| United Kingdom | 15M(55%) | Fibre | 2025 | |
| United Kingdom | 100% | Fibre | 2033 | |
| United States | 100M(80%) | 100 | 2020 | |
| United States | extensive | wireless | 2020 | |
Source UNESCO/ITU Broadband Commission | List of Plans (NZ: Wikipedia)(South Korea, Japan International Broadband Scorecard, Ofcom)
Fast Broadband (at/over 100Mbps) - Australian and Selected Top 10 Trading Partners
What was really interesting, and surprising, was China has rolled out an NBN since 2013, and now has 250M fast broadband connections (77% of fibre users; which are 93% of internet users; Future of NBN 6), compared to US 30M fast broadband users, where fast is at or over 100Mbps. Both countries report coverage of 90% for access to fast broadband services. US reports about 10 subs (of fast broadband) per 100 people, whereas China has close to double, around 20 subs per 100 people.
I also looked at more recent data from Ookla, which reports average speeds by country of its Speedtest service. Australia does not fare well on this metrics. Australia rates near the bottom of our Top 10 Trading Partners (Figure 4).

What I realised (in Figure 2 - gold bars), was that other countries have a lot of fast (over 100Mbps) connections whereas Australia does not. In 2018, we reported 0% fast broadband to OECD. In the Ookla graph from mid-2019, we showed close to 0% at or over 100Mbps. This year (around May 2020), NBN will release more affordable gigabit services for around 50% of users (FTTP, FTTC, HFC). I argued in my submission that even small percentages using gigiabit will have a significant impact on Australia's average speeds (which is often complained about). New Zealand currently has about 10% gigabit users, so this level of takeup seems quite possible for Australia too, if the price is affordable. So I am optimistic that Australia can increase its national download performance, if affordable prices can be set for gigiabit services.
| Scenario | Average Speed | Ranking against Top 10 Trading Partners |
|---|---|---|
| OECD 2018 | 21mbps | 10th |
| NBN post-build | 50mbps | 10th |
| 5% gigabit | 98mbps | 7th |
| 10% gigabit | 145mbps | 3rd |
| 20% gigabit | 240mbps | 1st |
Source: Appendix 5, Ferrers (2020) Submission.
Overall my recommendations in my submission (data at Figshare) were:
- Encourage NBN gigabit services at affordable prices.
- Update NBN Co's Statement of Expectations to upgrade the network (preferably bi-partisan), and guide how NBN Co will spend cash NBN will generate on debt repayment, dividends and network improvement.
- Focus NBN Co on encouraging use of the NBN (so we are more like China - heavily used, than US - accessible but less used at fastest speeds).
- NBN Co publish customer satisfaction results with the network by major customer categories eg business, consumer, FTTP, FTTN, FTTC etc. (bearing in mind that satisfaction comes from more than just speed eg ITU/UNESCO 2025 Broadband Goals), and lastly
- NBN Co include in its Corporate Plans a section on how Australia compares to other countries, along key performance metrics, and particularly the Top 10 Trading Partners. Ongoing NBN performance targets should reflect shareholder preference for Australia's performance relative to our major trading partners.
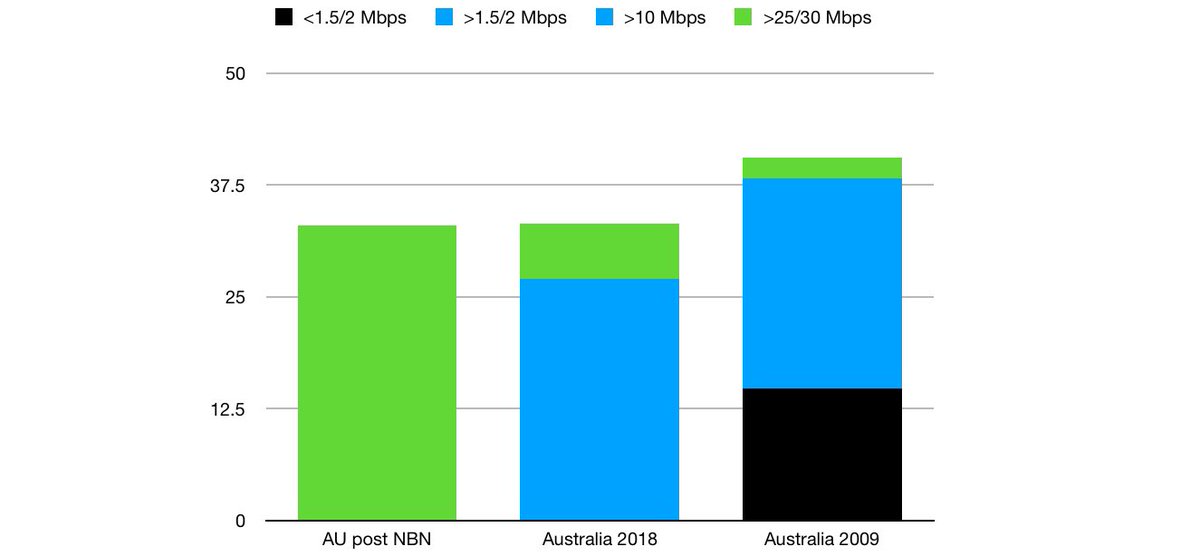
In contrast, and we should not forget, Australia has come a long way, with NBN and broadband from ten years ago. In 2009, nearly everyone had less than 25mbps, and about 30% had less than 2Mbps. Going back to 2006 (from ABS Internet 8153.0 Usage), some 45% of Australia was on dialup. In 2009, those still on dialup (1M users) were downloading 10Mb per month. The average in 2009 across all users was 4Gb per month. NBN recently (at end 2019) reported NBN users were using 250Gb per month). Extraordinary growth in download consumption.
Update: China reports (p.11,12) 2020 Internet development -
As of December 2019, the number of FTTH/O (home/office) 2019 users had reached 417 million, accounting for 92.9% of all fixed Internet broadband subscribers. The number of subscribers at/over 100Mbps reaches 85% of all fixed broadband users (up from 77% in 2019).