Thursday, February 29, 2024

Research Data vs VRIO; valueable, rare, imperfectly imitable and non-substitutable

... in progress....

What is VRIO?

Source: Jay Barney 1999? 

Haven't heard of VRIO, but sounds derivative of Michael Porter's work on Strategy. And especially Resource Based Theory. And especially whether resources are: (in order to Achiev[e] a sustainable competitive advantage)

  • Valuable - they enable a firm to implement strategies that improve its efficiency and effectiveness.
  • Rare - not available to other competitors.
  • Imperfectly imitable - not easily implemented by others.
  • Non-substitutable - not able to be replaced by some other non-rare resource (which looks like or very close to VRIO) There's a very big rabbit hole to go down here....

    Is Research Data intended to give SCA(sustainable competitive advantage)?

  • - the business of research
  • - the research of business

    How does competition relate to research?

  • - competing for grants
  • - competing for promotion
  • - competing for having answers generally accepted
  • - competing for policy influence
  • Friday, March 10, 2023

    China's broadband approach; FTTP makes a difference

    China over the last ten years has rolled out a superfast fibre-based broadband network, while Australia, who aspired to something similar, took a commercially conservative approach - abbreviated by the Coalition Government to "better, faster, sooner". At the time the Coalition won the 2013 election, China decided a FTTP network was the right approach. This approach is now showing up (ten years later) in the Global Rankings, Speedtest Global

    China is now in the Top 5 of countries (median speed: over 200Mbps) and has two of the Top 5 cities; Beijing and Shanghai; averaging close to 250Mbps). The median speed means 50% of users get faster than 200Mbps. Australia after some 15 years of NBN rollout, still sits (as a country) at around 80 in the world, with a median speed around 50Mbps. Our fastest city, Sydney, scrapes into the Top 100 cities in the world - slightly behind Kathmandu, Nepal (#92), Dehli, India (#87), Kharkiv, Ukraine (#85) and Moscow, Russia (#58).

    See  my dataset where I track Speedtest performance since 2017, for Australia's Top Ten trading partners. Partners include: US, China, NZ, UK, Germany, Thailand, Japan, South Korea, India and Singapore.


    Figure 1- 2017 to 2022 Speedtest Global (China, US, Australia) - Accelerating China fibre use

    Figure 2 - 2017 to 2024 Speedtest Global (China, US, NZ, Australia) - Accelerating US fibre use???

    China's Fibre Timeline

    YearResult
    2012 20M Fibre Users[1]
    2013 Broadband Strategy [1a]; 2015 Aim 20Mbps speed; 50% of Urban use. By 2020, Aim 50Mbps plus 50% at 100Mbps plus some gigabit.
    2014 34% on FTTH; 68M users [1]
    2015 57% on FTTH; 120M users [1]
    2017 84% on Fibre; 289M users; 39% at 100Mbps or faster [1]
    2019 91% on Fibre; 396M users; 77% at 100Mbps or faster [2]
    2020 93% on Fibre; 417M users; 85% at 100Mbps or faster [2][3]
    2021 93% on Fibre; 489M users; 93% at 100Mbps or faster; 34M gigabit [4]
    2022 93% on Fibre; 554M users; 94% at 100Mbps or faster; 92M on gigabit (16% of total) [4]
    June 2023 641M users; 94% at 100Mbps or faster; 128M on gigabit (21% of total) [5]
    Reality 1: Source: "Applications for it are pretty minimal ... It’s like putting a supercharged V8 on an ebike and driving it around Shanghai during rush hour. Like, yeah, in theory you could go super fast but the reality is less exciting."
    Reality 2: Source: "I usually don't bother with super highspeed internet in China since the bottle neck is your VPN (50Mbps)."
    May 2024 No update % on Fibre; No update on users; No update % at 100Mbps or faster; 163M on gigabit (26% of total); 5G users 805 million [6]
    Nov 2024 1.13B FTTH/O ports (up 35.4M from Dec 23; 97% of total ports); No update on users; No update % at 100Mbps or faster; 10G PON ports for gigabit reach 26 million (up 3M from Dec '23); No update on number of 5G users [7]
    SOURCE:
  • [1] CNNIC; 2017
  • [1a] China Broadband Strategy
  • [2] CNNIC 2019
  • [3] Tweets: Graph 2017 Graph 2019
  • [4] Tweets: Report Mar 2023
  • [5] Tweets: Report Aug 2023
  • [6] Source: CNNIC Report Mar 2024, p.18
  • [7] Source: CNNIC Report Nov 2024, p.8

  • Wednesday, May 4, 2022

    Value in elections; Australia's 2022 Electoral Advertising

    Gathering the data before the Aust 2022 election on May 21.

    Data:

    Friday, December 17, 2021

    Apple, AR, Cars and Value

    This post analyses why Apple may be interested in AR and developing a car. It structures my thoughts about both these potential technologies and why they might be attractive to Apple to create a product. Apple has been working on both technologies for a number of years, and invested thousands of hours and people's time into efforts to bring these technologies to the Apple community. 

    What does Apple say it will do? See case on Apple and Value in my book The Value of Value.

    Apple says it:

    - will "continue to make the best products in the world that delight our customers and make our employees incredibly proud of what they do" (Tim Cook 2011) 

    - is "unwilling to cut [corners] in delivering the best customer experience to the world. [It's] this relentless commitment to innovation and excellence [that] is the reason that our customer[s] choose our products and this will always be the driving force behind Apple... we remain very confident in our strategy and will use our world-class skill and hardware, software and services to delight our customer[s]" (Tim Cook 2012 Q4 Earnings Call)

    - "priced [iPad Mini] aggressively... delivering incredible value to our customers" (CFO Oppenheimer 2012 Q4 Earnings Call)

    - "will not make a product that somebody may feed good about it for the moment that they're paying for and then when they get it, they really ever use, that's not what we're about" (Tim Cook 2012 Q4 Earnings Call)

    - wants to build great products (Cook 2012), not the most products

    - wants to show "just how much we care" (Jony Ive in Macbook Pro unibody video and Grobart 2013)

    - "we will only do a few things... where we can make a significant contribution... to society at large... [with a] maniacal focus on making the best products... enriching people's lives" Cook in Tyrangiel 2012.

    - "very very simple focus on trying to make something beautiful and great." (Jony Ive on  Steve Jobs in Bergen (2015)

    - "instead of encouraging ..  or permitting a thousand ideas to bloom, Jobs insisted that Apple focus on just two or three priorities at a time - Ch. 35 Steve Jobs (Isaacson 2011), or "there are a thousand no's for every yes" (Jony Ive, AZQuotes)

    Other things that Apple do, but not say are;

    - create new user interfaces for mass markets eg mouse and WYSIWYG for Macintosh, touchscreen in ios/iPhone, digital crown in Apple Watch.

    AR 

    AR is glasses (or other projections) where digital objects are represented within our field of vision. That is traffic directions may appear as floating arrows directing us which way we need to go. Or our phone or computer screens are represented as floating in space rather than attached to physical output devices. Currently Apple provides AR on an iPhone as digital objects the phone can represent as the phone is directed around the user, using the sensors to tell in which direction and which angle a phone is pointed. Apple makes 3D AR versions of products, such as Macbooks, or logos of Apple Events. Thus in Pokemon Go, a pokemon may appear in front of us on the phone screen, in a certain direction and of a certain size.

    What problem does AR solve? AR can provide contextual information in the context of place, direction and angle. AR can also provide a larger if not endless screen for users. Rather than a 27" monitor, or a 50" or 65" 4k television (as monitor), AR can provide a 360* immersive screen, up to the sky and down to the floor. This can enable more content, and some users have large content use cases, such as brokers who have multiple screens or control rooms which have many gauges and dials to read. Similarly on our phones we have multiple messages, emails, posts to read. Each one could be represented as hanging in space rather than in a list, where we only see the title. Extra screen size of AR could enable a home for each message, each communication we receive.

    Does AR have application for a large number of users?

    iPhone is used by a billion customers, whereas Mac perhaps has only a hundred million users. How many customers might use AR? Does Apple care if only a proportion of iPhones users use AR? Will you need an iPhone to power AR - initially? eventually? 

    If all our messages were shown separately, then this view could be useful for anyone who has large amounts of messages, emails, tweets or texts. This could potentially benefit large numbers of users

    Can Apple make a significant contribution?

    AR may provide new use cases, not just of output but of input. AR could record our surroundings instead of displaying over our surroundings. For instance, AR could record our activity, including identifying objects we see, and classifying their location. So when/if we lose our keys, we can go back to the last time we saw our keys. Where did I put X? But this is a very niche action, that may perhaps only be used once a month.

    Another function of AR glasses would be as corrective lenses. If AR could correct what we see, so that we would never need to buy another pair of glasses, that is perhaps hundreds of dollars value. That could also potentially enable a new user interface to sharpen our vision to bring the world into focus. A potentially high impact contribution for users.

    What user interface could Apple use for AR? 

    If AR works through glasses, and has an unlimited screen space, then how does a user control that space? We could wait and see, but it is interesting and fun to speculate how to control such space. Could your hands control the space, like Tom Cruise in the movie, Minority Report (youtube link)? Could our fingers type on a floating keyboard?  Would voice make sense, dictating our commands, and text? Could our eyes and blinking control actions, looking and blinking to select and choose? Could a finger control a trackball on a ring? Or a finger touching a fingertip? 

    Update: Apple launched its AR Product - Vision Pro - on 2 Feb, 2024 for $3500 USD. About 200,000 units were sold in the first weekend.

    Cars

    Why would Apple make a car?

    Some underlying technologies of an electric car are like Apple technology - lithium batteries, cameras, screens, control software, power management, hardware design, user testing, meeting consumer needs. But why does this need to be a car? Could it be an electric scooter? An electric trike? As John Gruber suggested an electric autonomous robot, for inside the house? Electric skateboard? Electric roller skates?

    What problem does an Apple Car solve?

    Does an Apple Car have application for a large number of users?

    Can Apple make a significant contribution? See my recent thoughts. Maybe this market isn't a big enough opportunity for Apple to make a difference.

    What interface could Apple use for their car?

    Update: 28 Feb 2024 - Apple announced its car project, Project Titan, would be closed and many staff transferred to its AI, generative AI initiative.

    More to follow....

    What is the value of a dog?

    In Melbourne this year, we have had a lot of lockdowns, so one highlight this year, was the addition to the family, of a dog called "Banjo". His mother was a Kelpie, and his father was a Blue Merle Border Collie (see pic below). We say he is Border Collie at the front end (black and white and merle underneath), and Kelpie at the back end (black). He arrived in late June, a sprightly, fluffy 6kg, and now at year end, he was recently weighed at 16 kg. The lockdown has meant he has been mostly at home with us, while I work from home (like today), but he cries when he is left at home, and it breaks my heart. He is so joyous when we come home; wagging and dancing and rolling on the floor, getting much love and pats.

    Banjo (8mths) is loved.

    What value does a puppy bring?

    Love at first sight (8 wks)

    Of course, love - he is a new child in the family (to extend our only child little world), but one that grows faster than a human. By the time he is one year old, new research suggests a puppy is equivalent to a human at 40; past childhood, teenage and early adulthood.

    He is a new chore, to be fed, walked, played with, his waste managed.

    Banjo is a new threat, stealing clothes especially undies and dirty socks (the smellier the better), chewing Christmas presents under the tree, destroying a shoe, pulling clean clothes off the inside drying clothes rack.

    He is still a delight, sitting under my feet as I type, chewing a toy. He will sit on the bed, leaning on me as I read. He now sleeps in a bed in our bedroom, now accidents are less likely during the night. I did not expect that a working dog would be so relaxed. He will happily lie at our feet as we watch tv at night, sometimes cuddling up to us as we sit on the couch; where he also often curls up, for family time.

    Banjo's Parents

    Banjo is an exercise regime, making me walk, throwing his favourite ball.

    The Litter
    The Litter

    After ten throws, (chasing and some retrieving of the ball) at the park a few minutes away, he can pant for 30 minutes recovering from summer heat.

    Banjo is a learning exercise, as we all struggle  to communicate with him, train him to sit, bring the ball back, and when we leave home, the recent challenge is not to bark and disturb the neighbours.

    Banjo is also a tool; he experiences the world quite differently to me - acute hearing, a nose when he walks that chases many scents, which evade my senses, and when there is a ball or a stick involved - he becomes a laser focussed, one trick pony who has only eyes for one thing. Chasing a ball his feet thunder past, like a racehorse.

    Banjo is a financial cost; he was $500, plus shipping ($200) and came on a plane from Queensland, a two hour flight away, but was born, some 20 minutes drive from where my mother was born and now rests. Coincidentally, we were visiting my Mother's gravesite, on the day Banjo was born, not 30 minutes away, but did not meet him in person until ten weeks later. It cost another few hundred dollars to outfit our house for Banjo - a crate to sleep in, food, toys, leads, vaccinations and monthly worm, fleas and tick treatment ($20 per month).

    So Banjo is cost, love, duty, family, fun, time, novelty, and a power tool. So Banjo has many types of value, and overall the love suggests a strong positive emotion. Yet he also causes problems, yet these are overwhelmed by the positive feelings he generates.


    Friday, April 9, 2021

    Where are we at with the NBN?

     It has been nine months, since we passed the target build completion date for the NBN. In the half-yearly report, NBN generated a $0.4B positive EBITDA (effectively cashflow from operations), largely due to declining Subscriber Costs (down $0.6B), and increasing revenue (up $0.4B), while CAPEX is also close to half the previous year, declining from $2.5B to $1.4B for the half-year.

    NBN also commenced a post-build investment of $4.5B, announced in the Sept Corporate Plan, with headlines of enabling 75% of the fixed line network to reach gigabit speeds (the highest offered). This will enable all the FTTP, HFC and FTTC (and maybe FTTB) to reach the fastest speeds, and a proportion of the FTTN to be upgraded to enable an FTTP overbuild. There is $700M for regional business fibre hubs, and $300M for co-investment with rural and regional communities.

    On the demand side in 2020/21, there has been a significant slowdown of brownfield's new signups (See Figure 1; 2021 Avg 206k/Qtr, 2020 Avg 393k/Qtr, 2019 336k/Qtr, 2018 355k/Qtr):

    • Q1 20 - 325,000 additions
    • Q2 20 - 250,000 additions
    • Q3 20 - 130,000 additions
    • Q4 20 (budget) - 120,000 additions. Around 1% of 10M ready to connect premises.


    Figure 1 - NBN Consumer adoption (2016 - 21); Source NBN Weekly Summary. Data: Google Sheet.


    Figure 1a. - NBN Brownfield Additions 2021 - significantly slowing. Source/Data: per Figure 1.

    NBN retailers (RSPs) are being consulted about NBN's proposed pricing, looking forward for two years, and continue to complain about CVC variable costs, which put pressure on RSP margins, if consumers are not increasing their plan speeds and prices. Both Senate and large RSPs are keenly interested in the potential for NBN to reduce reliance and exposure to rising CVC costs due to increased consumer data demand.

    NBN revenue is nearing a $5B annual rate, with more boost from business usage (inc new fibre zones), and demand for consumer speed increases. NBN #FocusOnFast is the 2021 plan to lift subscribers from 50Mbps to 100Mbps and above, through a six month discount of $20-30 on the most expensive plans; reducing gigabit retail prices from $149 to $119, and 250Mbps from $129 to $99, and 100Mbps from $99 to $89 per month. These plans are mostly for unlimited data, so can incur greater CVC costs, though NBN bundles more CVC with the fastest plans to encourage higher plan usage.

    Current NBN penetration, given slowing additions, are at the following rates (see Figure 2):

    • Brownfields - 71% and slowly rising (2020 - 64%)
    • Greenfields - 66% and steady (2020 - 64%)
    • Wireless - 57%, jumped from 2019, but now slowly rising (2020 - 53%, 2019 - 43%)
    • Satellite - 26%, very slowly rising (2020 - 23%, 2019 - 21%)


    Figure 2 - NBN adoption by Technology (2016 - 21); Data NBN Weekly Summary: Google Sheet

    So NBN is reaching a revenue headwind period, where revenue growth will become more challenging, (and expensive) and come from:

    - new additions; new homes in Greenfield sites, or 1% organic growth in Brownfield sites, plus some potential for growth in Satellite and Wireless usage

    - lifting consumers to higher speed plans (increasing ARPU); with discounts to entice usage of faster speeds (#FocusOnFast); which will also be impacted by levels of NBN satisfaction

    - engaging more businesses on to the NBN (increasing overall ARPU); but which will require investment in a Business Sales force.

    A lesser opportunity for growth is through CVC, where rising consumer data usage incurs increasing CVC, which can either squeeze RSP margins, if prices are inflexible, or create price inflation, which could reduce demand and/or decrease satisfaction.


     Figure 3 - Sales and NBN Users - Corporate Plans (2016 - 24). Data: Observable

    Other issues:

    - NBN is refinancing its $20B debt with the Commonwealth, with private debt by mid-2024, and has also raised $10B private debt at low rates, enabling the post-build investment, and retiring of some Commonwealth debt.

    - NBN faces increasing competition from both 5G in slower FTTN suburbs, and more rural wireless sites, and LEOs in the Satellite footprint, but the $140 per month LEO pricing will be more attractive to higher end consumers or businesses. 

    - ABAC: The Minister, Paul Fletcher has appointed an Advisory Council to provide guidance around broadband generally and ABAC released its first report, Riding the Digital Wave. The Council will focus on specific industries eg Agriculture and Health, plus Digital Inclusion, Digital skills and small/medium businesses. (p.3)

    - In global competitiveness, Australia still compares poorly  (Data: Figshare) against our top ten trading partners in average national speeds (per Speedtest Global), though Feb 2021 saw a 20% increase in Australian national average download speed (from 59Mbps to 71Mbps; which looks like a year's growth in two months), perhaps from more gigabit services coming online. The speed jump would equate to about 1% takeup of gigabit plus 1% superfast (250Mbps) services; significantly higher (8X) than the 25,000 over 100Mbps services the ACCC reported at Dec 2020. ACCC's March report (expected late May) will provide takeup information for over 100Mbps services.

    Comparing Broadband Speed with Trading Partners

    Speedtest has made its data available globally (in anonymised 600m^2 blocks), so it is possible to see distributions of speed across the country. This enables our cities to compare with our Top Ten Trading Partners eg Shanghai, Bangkok and Los Angeles. Melbourne, for instance, has far slower distribution of broadband services compared to these overseas cities.


    Figure 3. Comparing Speedtest results of Australian and Top Ten Partner cities, Q3 2020 (Data; Figshare | Pic: Twitter thread).

    Further work - Broadband performance data (Speedtest) vs NBN Technology

    An activity to compare NBN technology maps (see https://www.data.gov.au/dataset/national-broadband-network-connections-by-technology-type) (showing regions of FTTP, HFC, FTTC, FTTB, FTTN etc) and average Speedtest results is underway. This will produce maps of Australia cities, showing distribution of speeds, and eventually average speed by NBN technology. There is also a plan to compare broadband speeds with SEIFA index, the socio-economic index of areas, to see if broadband speeds vary by wealth of neighbourhoods.


    Figure 4. Speedtest results across Melbourne Q2 2020; colour coded by speed (Data Figshare; Source: Twitter).

    The results show speeds vary across the city, with patches of faster broadband, north of Geelong, and in outer west, and in wealthy inner-east suburbs and slower on the fringes of the city, but across the suburbs, your mileage will vary. See Twitter thread for more images and analysis. This data is also loaded to the AURIN geospatial workbench, where Australian researchers can access the data online (Figure 5).


    Figure 5: Speedtest data available at AURIN geospatial workbench (Data/Image: Figshare).


    Figure 6: Speedtest data Q3 2020 - AURIN - three colour (less than 20Mbps; grey; over 90Mbps; blue; Rest = red) (Data/Image: Figshare).

    Friday, November 6, 2020

    Has FTTN paid for itself?

    I will analyse Communication Minister Fletcher's recent claim that NBN's FTTN has paid for itself. FTTN is the poor cousin to FTTP, the gold standard of broadband. Where FTTP is capable of terabits per second (10 ^ 12 bps), but twice as expensive as FTTN to install ($4000 vs $2000),  in contrast, FTTN suffers from degradation over distance from the fibre at the node, so 1/3 get very fast (<500m; up to 100Mbps and a bit more), 1/3 fast (500-750m; up to 50Mbps) and 1/3 slow (>750m; less than 50Mbps). NBN's plans in 2020 include enhancing half of NBN's FTTN footprint with fibre on demand, and upgrading FTTC and HFC to gigabit speeds, giving 75% of NBN's fixed line customers access to gigabit speeds.
     

    Background

    FTTN is one of the fixed line technologies, NBN (the National Broadband Network) uses to deliver broadband to Australian homes. It is part of Australia's MTM (multi-technology mix) approach that aims to deliver broadband to Australians at lowest cost to the Government and as early as possible, ensuring that nearly all Australians were ready to connect with broadband when the COVID-19 pandemic arrived in 2020. In contrast, Australia's prior government envisioned an NBN with largely FTTP broadband delivery, which is more expensive to install, but capable of very high speeds over potentially future decades. 

    FTTN uses copper phone lines to deliver the last stretch of broadband, while FTTP takes fibre right into the house. The longer the copper, the more the interference through the medium and the slower the broadband speeds to the user. NBN Co reported in its Corporate Report 2021 that FTTN users fell into one of three categories; 1. 1.2M who could get 100Mbps; 2. 1.9M who could get 50Mbps, and 3. 1.0M who could only get the baseline 25Mbps. FTTP in contrast currently enables 1000Mbps, with some countries now activating 10,000Mbps access speeds over fibre. 

    Australia's current government argues that most households are satisfied with their current access speeds, but are providing a way forward, as households demand higher speeds. NBN for instance launched cheaper 250Mbps and 1000Mbps services in May 2020, which attracted a few thousand new subscribers to these high speeds, and may have caused a 25% uptick in Australia's average broadband download speed.

    Upgrades Corp Plan 2021-24

    Following NBN Co's completion of the volume rollout in 2020 (99% complete, with 100,000 more difficult premises to finish), its Sept 2020 three year Corporate Plan announced investment to lift Australian broadband performance. To that point, NBN's goal in its Statement of Expectations was to provide all premises with at least 25Mbps by 2020, and 90% of fixed line premises with 50Mbps (as soon as possible). The Corporate Plan announced several investment strands, including:

    - business zones where businesses could get fibre services connected for $nil upfront on committing to a service

    - upgrade to HFC and FTTC technologies to gigabit service levels

    - upgrade of 50% of FTTN footprint to enable fibre on demand, when customer demands a fast service, which its FTTN can not provide, for $0 install cost to customer.

    Minster Fletcher

    In announcing the NBN Co Corporate Plan and committed investment, Minster Fletcher stated:

    "By 2023, the FTTN network will have generated $9 billion in revenues, cost $7.3 billion to build and $1 billion to operate. FTTN will have effectively paid for itself - and will continue to provide a very good service to millions of premises for many years, generating cashflows well into the future". CommsDay Speech, 27.10.2020. 

    Let's look at the "paid for itself" claim. 

    Assessing the claim

    The claim consists of three parts;

    - FTTN has generated $9 billion in revenue - I agree

    - FTTN has cost $7.3 billion to build - my estimate $11 billion

    - FTTN has cost $1 billion to operate - my estimate $2 billion, but full costs add another $20 billion.

    Revenue

    The NBN has generated $10 billion in revenue in the last five years (2016 - 2020); NBN Co Annual Report 2020, p.56. Over the next three years, NBN is budgetted to generate another $15.6 billion (Corporate Plan 2021, p.54). NBN revenue can be prorated by the types of technologies to apportion their revenue by technology type. At 2020, FTTN/B has 3.1 million activated premises from a total of 7.3M active connections - 42% of connections. By 2023, FTTN drops to 36% of connections as another 1.5M premises are activated but very few are FTTN (less than 10%). A first cut estimate of FTTN revenue is 43% of pre 2020 revenue, and 36% of post 2020 revenue; equating to about $9.6 billion. So close to Fletcher's claim.

    Build Cost

    NBN reports cost per premise (CPP) by technology. Per NBN Corporate Report 2020, NBN had 4.7M homes serviced by FTTN/B as CPP of $2340 (NBN Corporate Plan 2020, p.52). This gives total Build Cost for FTTN of about $11 billion. Added to this should be a proportional share of common CAPEX. The 2020 Annual Result presentation shows Commons CAPEX at only around 10% of total CAPEX, so would only make a minor difference. The NBN Annual Report does not break down Network assets by network technology type, nor identify levels of common capex. But NBN shows on their books a network worth $42.5 billion less $9 billion depreciation, for 11.7M premises ready to connect - an overall average of around $3600 per premise. So, overall the Minister's claim of FTTN costing $7B to build seems low compared to my $11B estimate.

    Cost to Operate

    In 2020, NBN reported Direct Network Costs of $641M, about 30% of total Operating Costs ($2.0B) NBN Operating Result Presentation 2020, p.11. From 2016 - 2020, NBN reports Operating expenses totalling $9.4B (NBN Annual Report 2020, p.56). Using the 42% share of revenue as above, the FTTN share of Operating Expenses would be around $4B, and likely direct network costs at 30% of $1.2B. For 2021 - 2023, Operating Expense can be calculated as Revenue - Subscriber Payments - EBITDA or ($15.6B - $1.4B - $8.6B = ) $5.6B. The FTTN share at 36% would be close to $2.0B, with Direct Network Costs (30%) around $0.6B. So my estimate of total Direct FTTN Network costs of ($1.2B + $0.6B) around $1.8B, close to double Minister's Fletcher's estimate.

    However,  how much of non-direct Operating Expenses should be attributed to FTTN. Should it include employee costs (around 30% of operating expenses), subscriber acquisitions costs (close to $10B). Addition of these costs would increase FTTN related expenses to $2B (employee costs) and roughly $4B for related subscriber costs). There is also depreciation and interest cost incurred by NBN, which in 2016 - 20 are in the order of $15 billion. A share of FTTN would add another $6B to FTTN's bill. Thus total expenses related to FTTN would be closer to $14B (2016 - 20) while the direct costs to operate, I estimate are around $2B (2016 - 23). To add the 2021 - 23 portion of FTTN costs, would add another $2B of employee expenses and 3/5 of depreciation/interest, so close to $3.5B. Grand Total Expenses: $21.5B  Thus the $1B FTTN Cost to Operate is extremely light on in excluding employee costs, subscriber acquisition costs, depreciation and interest, understating total costs by close to $20 billion over 2016 - 23.

    Conclusion

    Thus I would argue that FTTN has not paid for itself. Even with a narrow view of network operation costs, margin earned by FTTN services has contributed around $7 billion to NBN operating funds, while I estimate build costs at $11 billion. A fully expensed costs of FTTN is closer to $20 billion for 2016 - 23, including employee costs, depreciation and share of subscriber costs.


    Friday, July 3, 2020

    To Gigabit or not to Gigabit

    As the NBN rolls past its completion date, the Government is strangely silent choosing not to mark the occasion. Perhaps remaining quiet before this weekends by election. A new report out in the last few days is titled “ the gigabit gap “ argues for Australia’s weak international ranking on gigabit aspiration.


    • Gigabit is 40 X the mandatory speed promise for all. (25 Mbps)
    • Gigabit is 10 X the previous top speed available widely. There were business plans ($800/mth) and 250 plans availed on FTTP, which makes up about 20% of the NBN.
    • Gigabit is on the roadmap for 50% of NBN, inc FTTP, HFC and FTTC.
    • NBN has committed that all HFC will have access to 250 Mbps by June 2021. But at release of new high speed plans (end May) only some 7% of HFC could get gigabit speeds. Home Superfast (250 Mbps) was available to 32% of NBN ready to connect, NBN said, inc up to 70% of the HFC footprint.

    What’s in a name?

    NBN calls fast 100Mbps, Superfast 250 Mbps, and Ultrafast 500-1000Mbps.
    But ACCC called Superfast when referring to 25Mbps.
    NBN calls a 25Mbps service, Home Basic.

    The NBN SOE aims for universal very fast broadband - “ The Government is committed to completing the network and ensuring that all Australians have access to very fast broadband as soon as possible, at affordable prices, and at least cost to taxpayers. The Government expects the network will provide peak wholesale download data rates (and proportionate upload rates) of at least 25 megabits per second to all premises, and at least 50 megabits per second to 90 per cent of fixed line premises as soon as possible.”

    I would agree that 250 Mbps is very fast, beyond fast, and so the NBN according to the SOE should be pursuing universal access to this service AS SOON AS POSSIBLE. So for now Australia has universal basic broadband, and we are still waiting for universal very fast broadband.

    “The Statutory Infrastructure Provider (SIP) obligations ensure that all Australian premises are able to access superfast broadband services (25 Megabits per second (Mbps) or better).” Dept of Communications

    “Our priority is to help deliver high speed broadband to premises across Australia and, as we complete the initial volume build to 11.5 million premises7, we are starting to unleash higher speed tiers on a phased basis,” said Brad Whitcomb. “Launching the three new higher wholesale speed tiers is the next step in our network evolution and we will continue to upgrade the network to offer higher speed services to more customers over time.”, NBN said.

    Friday, January 31, 2020

    The future of the NBN (7); Inquiry into the business case of the NBN

    In October 2019, the Parliamentary body overseeing the NBN - the Joint Standing Committee on the NBN, launched an Inquiry into the Business Case for the NBN and the experiences of Small Business.  Submissions were due a couple of weeks ago (17 Jan), and my submission (#16) went public this week. Data is at Figshare. I previously responded to a similar Inquiry in 2018 (Data) with a model to calculate the value of the NBN. On 25 Feb, I will talk on this topic at Telsoc. Slides now available at: Slideshare.
    Slideshare

    Committee Focus

    The Committee were interested in "the rollout of the [NBN] and the performance of nbn co", particularly:
    a.the economics of the NBN, including key operational and financial performance forecasts in the Corporate Plan 2020-23;
    b.current pricing structures, including wholesale pricing, affordability and take-up, particularly as they relate to low-income and rural and regional customers;
    c.network coverage issues; including reporting of outages planned and unplanned
    d.the delivery of the business segment strategy, including to enterprise and government customers, and small to medium businesses;
    e.the experiences of small and medium business in relation to the utilisation, accessibility, customer service and affordability of the NBN;
    f.compliance with the NBN Statement of Expectations and adequacy of that Statement
    g.any other related matters. Source: Parliament of Australia

    Australia vs OECD and Top 10 Trading Partners

    I presented the material from the future of the NBN posts (1-6), especially NBN speeds vs OECD, but narrowed that down to Australia's Top 10 Trading Partners (Source; OEC - Observatory of Economic Complexity), which are an interesting mix of countries, including:
    • China | United States | Singapore
    • South Korea | Japan | New Zealand
    • Thailand | India | Germany | United Kingdom.
    Australia per OECD (2018) was close to the bottom (see Figure 2 below), but post-build NBN, we come back to middle of the pack. An Appendix shows the NBN plans for each of these countries (Table 1). The Broadband Commission produced a nice summary graphic (Figure 1) comparing NBN target speeds and coverage for UK, EU, USA, South Korea, NZ and DE (plus others).
    Figure 1. Broadband Commission summary of NBN Plans; Australian and Top 10 Trading Partners highlighted. Broadband Commission: The State of Broadband (2018), p.37.

    Figure 2. Appendix 2 of Ferrers (2020) Submission. Australia Broadband speeds vs OECD (2018). Source: OECD 2018. Raw data (OECD xls).

    Summary of Australia's Top 10 Trading Partners - NBN Plans - Appendix 1 - Submission

    CountryTargetSpeed (Mbps)Year
    Australia 90%50 2020
    Australia 100%25 2020
    China 50%100 2020
    China 70% 502020
    China some10002020
    India 100% 50 2022
    India Villages10002020
    India Villages >10002022
    Japan 98% Fibre Now
    New Zealand 75% Fibre 1002019
    New Zealand 87% Fibre 1002022
    Germany 100% 502018
    Germany Regional1000 2025
    Singapore ?? oops left it out - in error
    South Korea 99% Fibrenow
    South Korea 50% >10002022
    Thailand Cities 100 2020
    Thailand 95% broadband 2020
    United Kingdom 15M(55%)Fibre 2025
    United Kingdom 100% Fibre 2033
    United States 100M(80%)100 2020
    United States extensive wireless2020
    Table 1: Comparing Australia's and Top 10 Trading Partners - NBNs.
    Source UNESCO/ITU Broadband Commission | List of Plans (NZ: Wikipedia)(South Korea, Japan International Broadband Scorecard, Ofcom)

    Fast Broadband (at/over 100Mbps) - Australian and Selected Top 10 Trading Partners

    What was really interesting, and surprising, was China has rolled out an NBN since 2013, and now has 250M fast broadband connections (77% of fibre users; which are 93% of internet users; Future of NBN 6), compared to US 30M fast broadband users, where fast is at or over 100Mbps. Both countries report coverage of 90% for access to fast broadband services. US reports about 10 subs (of fast broadband) per 100 people, whereas China has close to double, around 20 subs per 100 people.

    Figure 3.  Figure 1b. in Ferrers (2020) Submission. Millions of fast Broadband Subscribers. Australia and selected Top 10 Trading Partners. NB: Japan, South Korea did not report in OECD 2018.

    I also looked at more recent data from Ookla, which reports average speeds by country of its Speedtest service. Australia does not fare well on this metrics. Australia rates near the bottom of our Top 10 Trading Partners (Figure 4).


    Figure 4. Appendix 4 in Ferrers (2020) Submission. Download Average Speeds - Australia and Selected Top 10 Trading Partners. Ookla Global Index 2018, 2019.

    What I realised (in Figure 2 - gold bars), was that other countries have a lot of fast (over 100Mbps) connections whereas Australia does not.  In 2018, we reported 0% fast broadband to OECD. In the Ookla graph from mid-2019, we showed close to 0% at or over 100Mbps. This year (around May 2020), NBN will release more affordable gigabit services for around 50% of users (FTTP, FTTC, HFC). I argued in my submission that even small percentages using gigiabit will have a significant impact on Australia's average speeds (which is often complained about). New Zealand currently has about 10% gigabit users, so this level of takeup seems quite possible for Australia too, if the price is affordable. So I am optimistic that Australia can increase its national download performance, if affordable prices can be set for gigiabit services.

    ScenarioAverage Speed Ranking against Top 10 Trading Partners
    OECD 2018 21mbps 10th
    NBN post-build 50mbps 10th
    5% gigabit 98mbps 7th
    10% gigabit 145mbps 3rd
    20% gigabit 240mbps 1st
    Table 2: Adding Gigabit substantially raises Australia's national average broadband speed, relative to Top 10 Trading Partners
    Source: Appendix 5, Ferrers (2020) Submission.

    Overall my recommendations in my submission (data at Figshare) were:
    1. Encourage NBN gigabit services at affordable prices.
    2. Update NBN Co's Statement of Expectations to upgrade the network (preferably bi-partisan), and guide how NBN Co will spend cash NBN will generate on debt repayment, dividends and network improvement.
    3. Focus NBN Co on encouraging use of the NBN (so we are more like China - heavily used, than US - accessible but less used at fastest speeds).
    4. NBN Co publish customer satisfaction results with the network by major customer categories eg business, consumer, FTTP, FTTN, FTTC etc. (bearing in mind that satisfaction comes from more than just speed eg ITU/UNESCO 2025 Broadband Goals), and lastly
    5. NBN Co include in its Corporate Plans a section on how Australia compares to other countries, along key performance metrics, and particularly the Top 10 Trading Partners. Ongoing NBN performance targets should reflect shareholder preference for Australia's performance relative to our major trading partners.
    Afterword
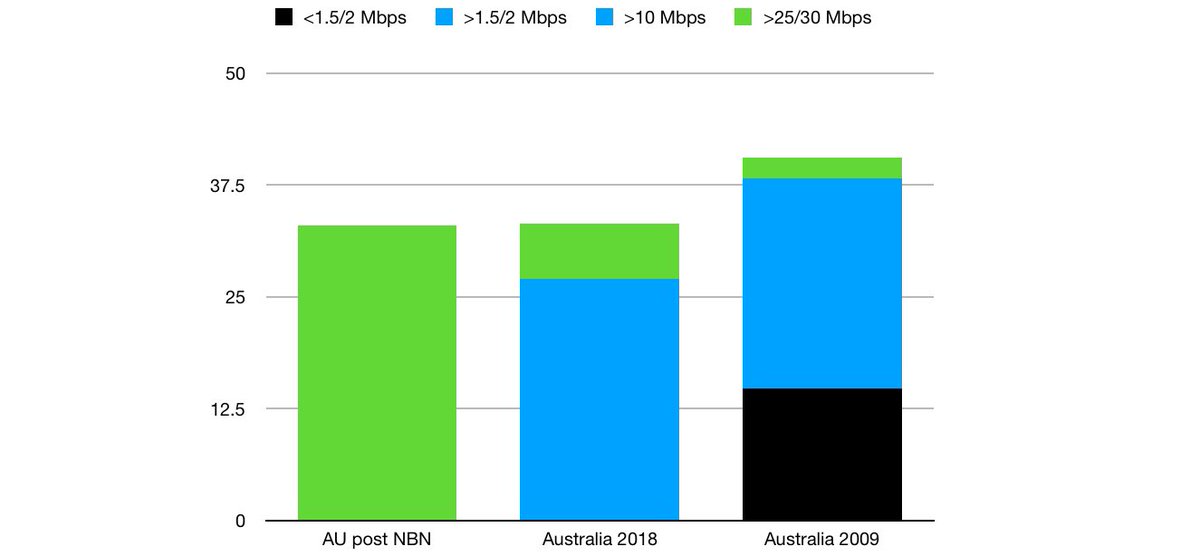
     In contrast, and we should not forget, Australia has come a long way, with NBN and broadband from ten years ago. In 2009, nearly everyone had less than 25mbps, and about 30% had less than 2Mbps. Going back to 2006 (from ABS Internet 8153.0 Usage), some 45% of Australia was on dialup. In 2009, those still on dialup (1M users) were downloading 10Mb per month. The average in 2009 across all users was 4Gb per month. NBN recently (at end 2019) reported NBN users were using 250Gb per month). Extraordinary growth in download consumption.

    Figure 5: NBN Speeds 2009, 2018, post-build. Source: ABS, OECD 2018, NBN Co. | Tweet

    Update: China reports (p.11,12) 2020 Internet development -
    As of December 2019, the number of FTTH/O (home/office) 2019 users had reached 417 million, accounting for 92.9% of all fixed Internet broadband subscribers. The number of subscribers at/over 100Mbps reaches 85% of all fixed broadband users (up from 77% in 2019).

    Friday, November 22, 2019

    The future of the NBN (6): UK(2030) vs China(2019)

    Two reports recently from China and the UK on their broadband rollout plans, report:
    • a promise "to deliver free full-fibre broadband to all individuals and business by 2030.... [further we] will aim to deliver free full-fibre broadband to at least 15-18M premises within five years" Link, Nov 16, 2019
    • Update: June 2019 report on Internet released (pdf); noting 395.75M Fibre (FTTH - Fibre to the Home, FTTO - Fibre to the Office) connections "accounting for 91.0% of all Internet broadband access users" (p.11) and 77% of broadband subscribers at 100Mbps or over; (p.11), up from 39% at the end of 2017.
    The first is the promise of the UK Labour Party for the upcoming December 2019 UK General
     Courtesy: Nick Youngson CC-BY-SA
    Election. The second shows the progress China has made in the last ten years. See graphs from the China report below.  You can compare earlier analysis I made of China progress (NBN Future Part 2), from 2012-17.

    UK

    UK regulator, Ofcom, reports (Sept 2019, p.9) that 95% of premises can access a 30Mbps broadband (superfast) service, while only 54% can access a 300Mbps (ultrafast) service (about 16M premises). In contrast, Ofcom reports current broadband connection (by technology) Q2 2019 as:
    • ADSL 8.4M
    • Cable 5.3M
    • Other (inc FTTx; predominantly Fibre) 13.0M - but full-fibre homes (2018) - 1.8M(Connected Nations, p.1).
    Another Ofcom report (International Broadband Scorecard 2018), comparing UK to EU countries and 18 other international countries (2017, Figure 1.8), breaks UK broadband down by technology and speed, noting VDSL is active in 35% of connections, cable 20%, ADSL 44%, full-fibre (1%). Also they report 14% of connections above 100Mbps (including 4% above 300Mbps), 42% under 30Mbps, including 2% under 10Mbps, and 44% in between (Figure 1.7).


    The same Ofcom report (International Broadband Scorecard 2018; Figure 1.26) notes that at the end of  2017,  Japan has 98% full-fibre coverage, and Korea over 99% full-fibre coverage (Source: IHS MARKIT), and (Figure 1.27), meaning that close to 100% (98-99%) of households in Japan and Korea have access to the fastest broadband (over 300Mbps). China is reported having 45% of households who can access similar (ultrafast) speeds (US 61%, NZ 70%, DE 34%, AU 0%; Figure 1.27, Fixed Broadband coverage by advertised speed). In Figure 1.29, the percent of broadband connections over 100Mbps (end 2017) is reported, including Korea (76%), Japan, (74%), Sweden (78%), US (28%), China (14%), UK(14%), NZ (11%), AU (3%), among .
    Interactive data is also available (full-screen required) providing international comparison.

    China Fibre Broadband (2019)

    Fig 11 Scale and Proportion of Fibre Broadband Users
    - CNNIC China Internet Statistics 6.2019, p.11

    Fig 10 Proportion of Subscribers of Broadband at the Speed of 100Mbps or above
    - CNNIC China Internet Statistics 6.2019, p.11


    China, in its annual Internet Statistics (CNNIC), recently updated for 2019, demonstrates a significant investment into fibre broadband. It also shows that China is close to completing a full fibre network with 395M fibre connection users; some 91% of all broadband users. Of these users, 77% are accessing broadband at 100Mbps or above (substantially more than the 14% reported in the Ofcom report - International Broadband Scorecard, at end 2017, mentioned above). When China (CNNIC) says fibre, they explain in a footnote (p.11) they mean FTTH/O - Fibre to the Home, or Fibre to the Office. An earlier post (Future NBN 1), shows China Fibre rollout 2012-17.

    The Labour Party says the UK is falling behind in broadband, with only 8-10% of broadband users accessing full-fibre services, which they compare unfavourably to Japan (97%) and South Korea (98%). These percents turn out to be percent of households with access to, rather than subscribers of, fibre broadband. Japan has 60% households connected to full-fibre, whereas South Korea has 40% or 80% connected to fibre, depending how you classify one type of common Korean broadband connection.

    South Korea

    My previous examinations (NBN Future 2) of South Korea, showed in 2017 only around 40% on full-fibre, with 25% still on HFC and ADSL. A significant category called LAN, is likely to be FTTB (connecting the basement of residential buildings to fibre, and using LAN to distribute broadband within the building), had around 40% of broadband subscribers. Even if LAN and FTTH were both counted (about 80%), the total is substantially lower than the 98% the Labour Party suggests.
    Recapping (Netmania), South Korea's broadband connections (2017) consist of:
    • LAN (presumably FTTB): 8.6M (40%)
    • Fibre to the Home: 7.7M (36%)
    • HFC: 4.0M (19%)
    • DSL: 0.9M (5%)
    NB:See further Korea broadband data noted in the UK Ofcom report (International Broadband Scorecard) mentioned above.

    Japan

    The Japan Statistics Organisation - Statistics Bureau of Japan reports on telecommunications including fixed broadband services, for their 53M private households (Link, Ch. 2). The 2019 Statistical Handbook of Japan reports total 41M fixed-broadband subscribers (Table 8.6. Subscribers to Telecomms Services (2018), p.93 - totals to 42M, strangely):
    • Fibre to the Home: 30.3M (72%)
    • Cable Internet (HFC presumably): 6.9M (16%)
    • DSL: 2.1M (5%)
    • ISDN: 2.9M (7%)
    NB: See further Japan broadband data noted in the UK Ofcom report (International Broadband Scorecard) mentioned above.While these figures represent significant users of broadband (Japan is placed 3rd in the world behind US 110M, and China 393M; p.94), rather than who can access broadband, the number of full-fibre users is substantially lower than the Labour figure, closer to 60% of total households, than the Labour Party suggested 97%.

    China

    What the Labour Party seems to be missing, is that while the UK is far behind Japan and South Korea, the UK is also substantially falling behind China. China's 395M full-fibre connections (Fig 11 above) is a significant proportion (86%) of their 456M total households (Wikipedia). Not only are fibre connections in place, but there are subscribers using the services, and 77% of those subscribers are consuming broadband at 100Mbps or more. In Summary, China's broadband is:
    • Fibre to the Home/Office: 395M  (91%)

    So, the UK is looking ahead to a broadband future, where everyone is connected in 2030 to full-fibre (and 60-70% within five years; that is 15-18M households of total 26M; Wikipedia). Japan is 60% full-fibre connected there now (but every house can access fibre, per Ofcom). Korea is 80% full-fibre connected there now (if you count FTTB as full-fibre, only 40% if you don't). But China is close to already fully connected with close to 90% already on full-fibre, and with the result that nearly 80% of subscribers are using broadband at speeds at or above 100Mbps.

    In contrast, Australia reports to OECD (end 2018), 0% broadband users at speeds at/above100Mbps (NBN Future 1).

    Friday, August 30, 2019

    The Future of the NBN (5): Fast National EU Plans vs Fast Services

    In the last post I looked at EU NBN (national) plans for 28 countries. These national plans nicely group into several different target clusters, including:
    Compare: Pixabay

    • 30mbps coverage by 2020 (Many including Greece, France, Spain, Poland, Hungary, Ireland and 12 others )
    • 50mbps coverage by 2020 (Germany)
    • 100mbps coverage by 2020 (Sweden, Italy 85%, Netherlands 2023)
    • 1000mbps coverage by 2025 (Luxembourg 100%, Sweden 98%, Belgium 50%, Netherlands vast majority).
    I wanted to compare these clusters against current Speedtest world speed rankings. When they didn't compare neatly, I thought about what other broadband indicator is going to give a better indicator of fast average usage, than a national target. That's when I thought to compare average speed (per Speedtest Global Index) with OECD count of number of very fast users (over 100mbps).

    In national targets, Australia sits close to Germany, with 90% of fixed line aiming to get 50mbps, and rest 25mbps.

    Let's compare.

    NBN target (mbps)Cntry Speedtest Ranking  Speed Down Users/100 over 100mbps(OECD 2018)
    30mbpsGR 96230
    30mbpsFR 151085
    30mbpsESP 171079
    50mbpsAU 60 400
    50mbpsDE 34736
    50-100mbpsCN 2490>4
    100mbpsIT 46518
    1000mbpsLX 16107na
    1000mbpsSWE 1411026
    1000mbpsNE 209914
    Table 1: Speedtest results (2019) - Ranked by NBN Target
    The first table compares NBN targets for country with Speedtest actual speeds. The Speedtest rankings do not line up very well with the NBN targets for each country. France and Spain have low targets but high rankings. Italy and Australia have a quite high national target but quite low Speedtest rankings. NB: China has 4% superfast users - data is only found for gigabit users (post 2).
    Now we retry the comparison, sorting by percentage of very fast users (over 100mbps). I include CN (China) data from my post below. OECD data (xls) comes from post below too.
    NBN target (mbps)Cntry Speedtest Ranking  Speed Down Users/100 over 100mbps(OECD 2018)
    50mbpsAU 60 400
    30mbpsGR 96230
    50-100mbpsCN 2490>4
    30mbpsFR 151085
    50mbpsDE 34736
    100mbpsIT 46518
    30mbpsESP 171079
    1000mbpsNE 209914
    1000mbpsSWE 1411026
    1000mbpsLX 16107na
    Table 2: Speeedtest results (2019) - Ranked by Users of 100+mbps (OECD 2018).
    Source: Speedtest Global Index - July 2019, EU summary of NBN plans (post 4), OECD (post 1), China (post 2).
    The second table compares adoption of over 100mbps speeds (OECD 2018) with Speedtest actual speeds.
    This analysis suggests that the Speedtest ranking is more closely related to (1) how many users are on fast (over 100mbps) speeds than (2) what the country's NBN target is. Again Italy stands out as a high performer on number of very fast broadband users, but scores low average Speedtest results. This suggests there are very fast and very slow speeds available across the country leading to a lower average. Australia, Greece and Italy are the only countries not exceeding their national broadband targets (excluding the gigabit targets).
    Conclusion: To improve your average speeds, you can either lift everyone's speeds, or push superfast access to a small minority. Small percentage levels of 1000mbps can substantially lift average speeds.

    Wednesday, August 21, 2019

    The Future of the NBN (4): EU collates their National Broadband Plans

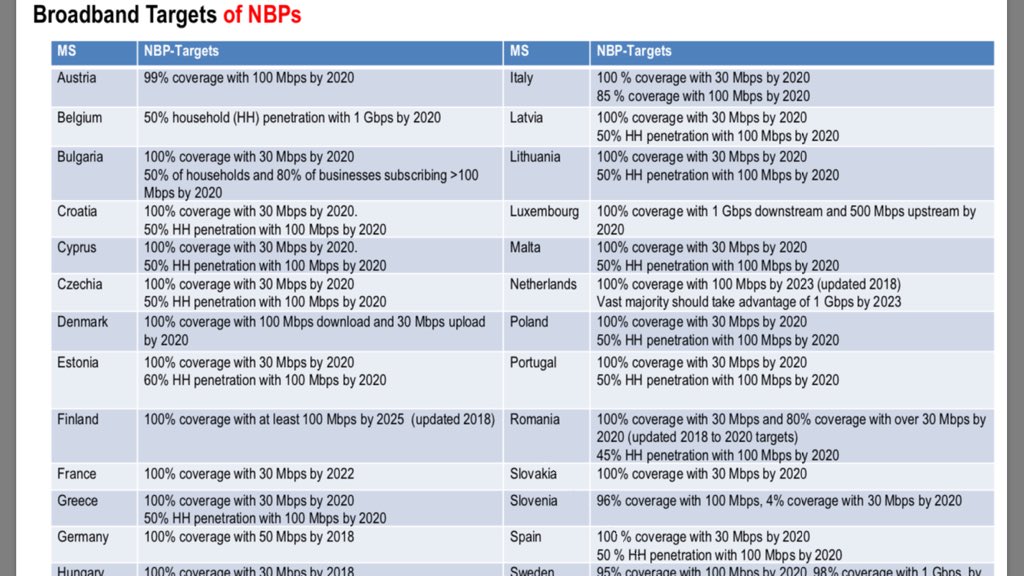
    As Australia's NBN approaches completion, some 12 years after Kevin Rudd took the NBN to an Australian election, many nations are now nearing completion of their own version. A European document, neatly compares 28 countries within the EU, and their national broadband targets. I summarise this list below.

    Data: See the EU document (pdf - Slide 37), html. Full Report (pdf 328pp), and EU Strategy for a Gigabit Society.
    EU National Broadband Plan - Targets
    Some examples include:
    • Slow: Greece/Italy 100% coverage - 30mbps - 2020 (plus 17 others)
    • Usage: Greece/Spain 50% penetration (ie usage) - 100mbps - 2020 (plus 14 others)
    • Medium: Germany 100% coverage - 50mbps - 2020
    • Fast: Netherlands at 100% coverage - 100mbps - 2023 (plus six others similar eg Italy 85%, Sweden 95% at 2020)
    • Superfast: Sweden 98% coverage - 1Gbps - 2025 (plus Netherlands (vast majority), Belgium 50% and Luxembourg 100%)
    • UK 100% fibre coverage - 2033 (and 15M premises by 2025).

    Comparing EU to AU

    Looking at these clusters, Australia's NBN seems to sit closest to Germany, with 90% of fixed line network, getting at least 50Mbps, as well as the base 25mbps target for 100% coverage. Australia has neither a usage target (besides Corporate Plan targets of 75% usage) nor gigabit target. The current MTM allows up to 50% of premises to access gigabit once NBN activates upgrades to HFC, FTTC, FTTP.
    Structured data (csv) follows: (MacOS 10.14.6 Numbers 6.1)

    Country,Cover%,Type,Speed (mbps),Date,Comment
    Greece,100,coverage,30,2020,"Inc Cyprus, Spain, Malta, Poland, Lithuania, Latvia, Italy, Czechia, Croatia, Bulgaria, Estonia, France (2022), Hungary (2018), Ireland, Portugal, Romania (inc 80% > 30mbps), Slovakia, Slovenia (last 4%)"
    Greece,50,Penetration,100,2020,"Inc Bulgaria homes (Businesses 80%), Croatia, Cyprus, Czechia, Estonia (60%), Hungary, Ireland (inc 17-21mbps up), Latvia, Lithuania, Malta, Poland, Portugal, Romania (45%), Spain, Sweden"
    Germany,100,coverage,50,2018,
    Belgium,50,Penetration,1000,2020,"Inc Luxembourg (100% coverage, 500Mbps up), Netherlands (vast majority by 2023), Sweden (98% coverage by 2025)"
    Denmark,100,coverage,100,2020,"Inc Denmark (30mbps up), Sweden (95%), Austria (99%), Finland (2025), Italy (85%), Netherlands (2023), Slovenia (96%)"
    UK,100,Full fibre,n/a,2033,Inc 15M premises by 2025
    // Source: https://t.co/YFd9pA8LZe - slide 37

    Friday, August 2, 2019

    The Future of the NBN (3); the business opportunity

    The national NBN rollout is coming close to its finish, with now 11 months until expected completion. By 30.06.2020, all premises should be RTC (Ready to Connect), some 11.8M homes and businesses. But the Corporate Plan while targetting eventually some 75-80% users, expect activations to ramp up from:

    When | Planned NBN Activations
    30.06.19 | 5.5M
    30.06.20 | 7.5M
    31.12.20 | 8M
    30.06.21 | 8.4M
    30.06.22 | 8.7M
    Source: NBN Corporate Plan 2019-2022.

    Current NBN ARPU is around $44 per month (total revenue 2019;  $2.6B), with a expected rise to $54 in 2022 (total revenue 2022, $5.6B). These numbers update annually, with the Corporate Plan for 2020-2023 to be released shortly. What those ARPU numbers average out is the split between business and home revenue. Business services while much smaller in number, are substantially greater in revenue per premise.

    For our home broadband service, for instance, I pay $60 per month  to retailer Exetel (which is about NBN $45 wholesale), for a 50Mbps unlimited data line. Plenty of speed for a small family, watching 4K video and a home office running low bandwidth applications. But what if I wanted to upgrade to gigabit service with business grade services?

    What does Enterprise broadband cost? Enterprise NBN?

    I can get a 200/200 Telstra fibre service through my current broadband provider, Exetel for $1000/mth, on a three year contract with $0 setup. I can get a gigabit service with a three year contract from TPG ($880/mth; $1100 setup), iinet ($880/mth; $1800 setup) or AussieBB ($770/mth; $0 setup). The AussieBB service is a TC4 best effort service (with 100/100mbps speed shaping during home video peak hours 6pm to 12am). AussieBB also offers a TC2 committed bandwidth service accessory at 50/50mbps for $440/mth extra. Support packages are an extra $220/mth (Silver support, 99% uptime) or $330/mth (Gold support, 99.95% uptime). All these services come with unlimited data.

    It is clear that these business NBN / fibre services are significantly more expensive than my $60/mth home NBN service. But the NBN services are significantly cheaper than the Telstra product, which Exetel is offering. Up to five times faster (1000/400 vs 200/200) for a similar or slightly better price ($1000 vs $800 per month).

    It is interesting to look at the prices for the business service. You need to leave your name, and contact details, so a salesperson can talk to you about the service. And then they send the prices to you. This was my experience with Exetel and AussieBB. TPG and iiNet did show the prices for Enterprise Broadband on their websites, and are 1000/1000 symmetric services. AussieBB is an up to 1000/400 Enterprise service on NBN.

    Another NBN Business service is called Enterprise Ethernet (pdf) with speeds up to 1000/1000, $0 install on three year contract, and available as an upgrade anywhere in the NBN fixed line footprint. Downloading a brochure for the service requires providing your name, company name, and contact details (phone and email). The brochure doesn't seem to provide specific costs for Enterprise Ethernet, beyond the TC4 (best effort; 1000/400 at $770/mth) and TC2 (committed rates; 50/50 at $440/mth).

    What is the potential revenue from the Business Internet market?

    The ABS provides statistics of number of businesses in Australia by size. In total there are more than 2.3M active businesses in Australia, but most are small. There are 1.3M businesses with no employees. There are 0.8M businesses with some but less than 20 employees. Around 50,000 have between 20 and 200 employees. And only 4,000 have more than 200 employees.

    Employees | Count of Businesses
    0 | 1.3M
    1-20 | 0.8M
    20-200 | 50K
    >200 | 4k

    It is likely that the no-employee businesses (unless in a specifically technical industry, such as video editors) would likely use just home level NBN, particularly if they can access 100/40. NBN has promised that 90% of the fixed line footprint will get 50mbps and 25mbps for everyone else.  But businesses with multiple employees would likely need Enterprise NBN. If all of the 1-20 employee businesses took a $500/mth Enterprise Broadband service, that would generate around $5B revenue per year, equivalent to all the expected NBN revenue. Obviously, this revenue would be highly contested between those telcos with substantial fiber networks, such as Telstra, Optus, TPG, Vocus, who can reach many businesses. But NBN's advantage (opportunity) and weakness (who to target) is that NBN runs past every business.

    Businesses with larger numbers of employees (over 20) would pay substantially more per business for internet. These businesses would be the site of substantial competition for their telecom expenses.

    What NBN revenue might employee broadband generate?

    AARNet generates $80M revenue (Annual Report 2018) for providing internet to the University (and education) sector, which employs 130,000 staff (excluding schools). This works out to about $50/mth per person. This is a little overstated, since there would be schools generating revenue whose staff are not counted, making the average a little high. Nevertheless, each employee is a potential roughly $50/mth NBN revenue source for internet costs. With 13M current employees (Labour Market Information Portal, May 2019), that equates to about $8B revenue per annum, in possible NBN revenue.
    I can think of businesses with lots of staff but not much need for internet eg restaurants. I can think of businesses with few staff but lots of need for internet eg anything video related, software related, data related, research related.

    Summary

    The Business market is a substantial opportunity for the NBN, but with likely significant competition from the likes of Telstra, Optus, Vocus and TPG. There are billions of dollars in play. With likely costs per employee to fall to around $50/mth for internet (AARNet's cost for the University sector). How much of a premium telcos can extract from businesses for Enterprise quality NBN remains to be seen.

    However, it is possible NBN could generate substantial ($billions) revenue from businesses. Even a 10% market share is close to $1B annually, which would reduce the ARPU for homes required for the NBN to break even and repay its debts. A 50% business market share could go close to double NBN's revenue and pay for substantial upgrades to the fixed line network.

    The opportunity is there for NBN to seize, and for Telstra and competitors to lose.
    ==
    Update: 15/8/19 NBN Co reports their 2019 result includes Business Revenue of $388M up 54% on FY18 ($252M). This is 14% of total revenue $2.83B (up 43% FY 18 - $1.98B), and similar to FY18 business proportion (13%). ARPU increased from $44 to $46 per month.